• Enter your email address to follow this blog and receive notifications of new posts by email.

    Join 28 other subscribers
  • iMapLibraries Facebook

  • Follow iMapLibraries on Twitter

  • iMapLibraries Slideshare

    iMapLibraries Slideshare

    ALA 2013 iMapLibraries Slides

Are Library Closures Fair to Everyone?

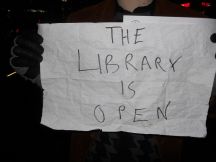
photo: "the library is open"

Creative Commons Flickr photo by EmilyDickinsonRidesaBMX

In our last blog post, the iMapLibraries team began discussing equity and fairness in library closures, and how planning tools might help to identify potential issues. We used the example of examining differences between the group of libraries in Miami-Dade County that have been selected for possible closure, as compared to those libraries that are expected to remain open. We can further analyze that data to identify possible ways for reducing the potential impacts of closing 22 library branches. The data we used is from the 2010 Census.

We noted that as a group, the libraries to be closed serve a higher percentage of Hispanics than the libraries that will remain open. Our analysis of the library branches with the highest percentages of Hispanics in their market areas show that five are to be closed and five are to remain open, which is consistent with approximately half of the library system’s branches overall being closed.

Our study also noted that libraries to be closed serve areas with a higher percentage of households of other races with more linguistic isolation than the libraries remaining open. (Linguistic isolation reflects those who speak a non-English language at home, and who also do not speak English very well.) County-wide, less than four percent of households fit into the other race category. But over 10% of households in the North Shore market area fit into this category as well as almost 7% of the Lemon City market area. Over 10% of the households in the library market areas of Little River and Lemon City are linguistically- isolated, the highest percentages in Miami Dade County overall.

As a group, the average median income, average per capita income, and average median home value for the block groups in each library’s estimated geographic market area are higher for libraries that are to remain open as opposed to libraries that are to be closed. Nine of the ten library branches in market areas with the highest average median home values will remain open (i.e., Pinecrest, Key Biscayne, Coral Gables, Palmetto Bay, Coconut Grove, South Miami, Coral Reef, Sunny Isles, and Northeast); the sole exception of a high home value area to be closed is the Virrick Park branch. In contrast, depending on the market area model used, from four to five of the ten library branches with the lowest average median home values for their market areas will be closed (Model City, Civic Center, Opa-Locka, and Culmer/Overtown).

Another way to look at equity and fairness is to examine the library usage statistics at the various branches. This is where we need to be careful to be sure that we are comparing oranges with oranges. Library use at the Opa-Locka library will obviously be lower than usage at the main Miami-Dade library. But by using an estimated geographic market area that each library branch serves, we can base our calculation on the population size residing within each of the different library branch market areas to calculate the library use per person being served. In more statistical terms, we are beginning to standardize the data so that we can more accurately compare public library branches in very different settings.

The statistical report on selected usages at the various branches of the Miami-Dade Public Library System from October 2012 through April 2013 provided an in-depth look at the door count (i.e., visitors through the library door) and the computer usage count for all of the branches. A look at some of these basic statistics in combination with the per person usage based on each branch’s geographic market area provides this information:

1) the to-be-closed Model City branch serves one of the poorest areas of the county and on a per person basis using the one-mile and gravity models, it is estimated to have one of the ten highest branch usages of PCs (.488 vs. .356 county-wide) as well as door count among all the branches (2.273 vs. 1.478 county-wide).

2) the to-be-closed Lemon City branch has one of the three highest per person usage of any Miami-Dade county library based upon the gravity model (3.187), with only the Main Library and the Miami Beach Regional Library being higher (10.988 and 3.813, respectively) The Lemon City branch also serves a high percentage of renters with limited transportation options as well as high numbers of social security recipients.

3) the to-remain-open Northeast branch has the lowest door count outside of the specialized Civic Center branch (a “porta-kiosk” located on the elevated public transit platform) and has one of the two lowest per person usages based on both door counts and PC usage of any branch in the county. It is approximately 2.25 miles from the next nearest branch by road. In comparison, citizens may have to drive twice the distance to obtain library service if some of these five other branches are closed: Country Walk, Doral, Hialeah Gardens, Lakes of the Meadow, and North Shore.

We provide these examples to show how planning data using geographic market areas can be a useful way to identify potential planning issues for libraries, and can allow managers to explore and consider equity of access issues for the many unique and diverse populations living within a large citywide or countywide system. You can access our planning tool to explore market area data for your own local library, and read more about our data or visit our web site to find more information about the iMapLibraries project and downloadable data reports for the 22 Miami Dade libraries slated for closure.

– Dean Jue (DJue@admin.fsu.edu), Christie Koontz (Christie.Koontz@cci.fsu.edu), Lorri Mon (lmon@fsu.edu) and Laura Spears at Florida State University, for iMapLibraries

How Do You Choose Which Libraries to Close?

Creative Commons Flickr Photo by Tito Perez

Creative Commons Flickr Photo by Tito Perez

In our last blog post, the iMapLibraries team pointed out that one of the greatest risks of library closures is that select communities may become isolated from library services and resources. These communities may include poor people, elderly, children and ethnic minority groups who have more limited transportation options in reaching a library farther away.

In this post, we analyze the socioeconomic and demographic characteristics of the people who are likely being served by each of the 22 Miami Dade County library branches that were recently chosen to be closed, and we compare their characteristics with the branches that are to remain open. To make sure that the trends identified in the data are most likely correct, three market area estimation techniques were used (i.e., the one-mile radius, the two-mile radius, and the gravity model) unless otherwise noted. If a trend was noted in only one or two of the market estimation methods, that data was considered inconclusive. Results are based upon 2010 U.S. Census data.

Differences between Miami Dade libraries that will be closed as compared to libraries that will remain open countywide are:
1) The closed libraries serve a higher percentage of Hispanics than the libraries that will remain open.
2) Closed libraries have a lower percentage of English-speaking households and a higher percentage of Spanish-speaking households, especially among those between the ages of 5 to 64.
3) Closed libraries have a higher percentage of households speaking an Indo- European language with a higher degree of linguistic isolation than libraries that will remain open. (Linguistic isolation reflects those who speak a non-English language at home, and who also report that they do not speak English very well.)
4) The average median income, average per capita income, and average housing value for the Census block groups within the library’s market area is noticeably lower for those libraries that will be closed as compared to the libraries that will remain open.

The value of identifying the above differences is in creating the opportunity to solve issues of inequities if and when possible and prior to closures. For managers and planners there is also value in having a tool for comparing and identifying these types of issues with any proposed plans for library openings, closures or relocations within communities.

While this post has discussed the use of planning tools and data with the example of looking at proposed library closures in Miami-Dade County, such tools and data can be used in many other library planning scenarios for library managers all over the country (e.g., helping plan library programs, services, and facilities, addressing library service gaps, and meeting local community needs). One of our previous blog posts described some of the impacts the full closure of 22 library branches may have on some local county residents. These planning issues have major local importance not only due to impacts on neighborhoods and communities, but also because public libraries in the U.S. are funded at 98% average from local coffers.

Our next blog posting will look at the issue of equity and fairness on an individual library community level as opposed to the birds-eye view that this post has taken. In the meantime, you may be interested to download the library branch data for the 22 libraries to be closed in Miami Dade County, or to take a look at your own local library branch market areas with our prototype planning tool, and visit our iMapLibraries site for more resources and information: http://www.imaplibraries.org

– Dean Jue (DJue@admin.fsu.edu), Christie Koontz (Christie.Koontz@cci.fsu.edu), Lorri Mon (lmon@fsu.edu) and Laura Spears at Florida State University, for iMapLibraries

Who Loses When Libraries Close?

Miami-Dade Libraries

Miami-Dade Libraries

When a library closes, who may never use a library again? In our followup on the possible closure of 22 out of 49 Miami Dade libraries, we’re taking a closer look at how people in local communities may be affected by the closing of their local libraries. (See Rebrand Miami’s map showing blue pins for libraries to stay open, and red pins for the 22 libraries which would close.)

First, a note on how we did this research: our iMapLibraries project (http://www.imaplibraries.org) seeks to build a planning tool for local library data and to integrate this with U.S. Census data. We used gravity modeling to estimate a geographic market area for every library in the U.S. The gravity modeling method assigns everyone to their geographically nearest library. We had to choose a way to estimate this ourselves, since library systems sometimes do not estimate geographic market areas for each local branch library due to policies that “all are served” who walk through the door – a card for any library will let you check out items from any of the other libraries in the system countywide or citywide. Yet, to better understand what is happening at the local library branch level — such as the local impact of 22 neighborhood libraries closing in Miami Dade — you must start with at least some basic estimate of who each library serves, and where those people live. Some researchers use different methods such as drawing a circle at a one-mile or two mile radius around each local library. The data we present below for the Miami Dade libraries were checked and confirmed by all three of the market area estimation methods we used – the gravity model, one-mile radius, and two mile radius. However, all of these methods are still imperfect – the very best geographic market area estimate would ideally come from each library’s staff and the local planning office, and the very best demographic data would be up to the minute data (we used 2005-2010 U.S. Census Bureau data and 2010 Census data). Here is more info about our data and the limitations of our method.

As we saw last week, libraries provide more than just books. For families with children, libraries offer an alternative to the streets as a safe space in the local community for kids and teens to play, read, and participate in learning activities; when school ends, libraries run “summer reading programs” to help children maintain their reading skills gains into the next school year. We often hear the lament that “Johnny can’t read” — yet libraries are where many kids learn to enjoy reading. Among the 22 Miami Dade communities at risk of closing libraries, eight in particular have more than 40% of households as families with children: Doral, Country Walk, West Kendall, Hialeah Gardens, Lakes of the Meadow, Golden Glades, Opa-Locka, and Model City.

When libraries are nearby, kids can walk from home or school. In some cases, parents may not have the library and reading habit, and kids or teens who walk to the library from their homes or schools may end up teaching their parents about local libraries. But as distance increases, parents must spend time and money on transportation to take kids to the library — perhaps purchasing gas or paying transit fees, and trying to find time after work or between jobs. Longer travel distances over public transit could also be a barrier to library use since items often must be carried in both directions — books/videos to be returned, and new books/videos to be brought home. Parents using public transit could also be carrying or managing children at the same time. Among renters living in the 22 communities, at least 14% or more did not own a car for the library market areas of South Shore, Model City, Civic Center, Culmer/Overtown, Little River and Lemon City. Renters also sometimes don’t have time to develop relationships with neighborhood institutions such as their local library, particularly a farther away “next nearest” library.

Libraries serve many important roles in people’s lives as safe havens, centers for free education, and community gathering places — but an especially vital role is as community technology center for free access to computers, Internet, word-processing software, wifi and technology training. People in low-income communities may lack computers and Internet at home, yet employers now routinely expect online submission of resumes, and government agencies require forms to be filed and applications to be submitted online. Dial-up is also no longer sufficient for the bandwidth-intensive requirements of many web sites, necessitating expensive broadband or mobile access. Among the communities slated to lose their libraries, two that had per capita average incomes close to the federal poverty line for individuals ($11,490) were: Model City and Opa-Locka. (See a picture from Opa-Locka Library)

Many seniors living on fixed incomes rely on nearby libraries for free computer access and technology training, as well as newspapers and other special resources such as large print books, audiobooks and assistive devices for those with disabilities. Libraries often are part of the socialization and recreational routines for many seniors. Seniors may also particularly suffer in losing a local neighborhood library due to mobility impairments and difficulties with driving or using public transit to reach a more distant location. The communities slated to lose libraries which had higher numbers of Social Security recipients (seniors & disabled)– more than 30% — were Fairlawn, Concord, and Opa-Locka. Many of the other libraries had at least 20% (one-fifth or more) in their market area populations who were receiving Social Security, which suggests that if their local libraries close, it’s possible these areas could see increased demand for outreach services to seniors and disabled such as home delivery services or bookmobiles, as well as increased demands for large print materials, audiobooks, and assistive devices at “next-nearest” libraries. In addition to those other three libraries, the libraries with at least 20% or more of their local market area populations receiving Social Security were Model City, Sunset, Little River, Civic Center, Lakes of the Meadow, North Shore, Golden Glades, Virrick Park, Hialeah Gardens, California Club, Tamiami and Lemon City.

We noted last week how libraries reflect the communities they serve by offering special collections and services, such as African American art and book collections and Spanish language materials and workshops. Miami-Dade is diverse, vibrant and multi-cultural, and among the libraries on the list to be closed are libraries with “majority minority” populations – that is, over 50% Blacks or Hispanics. The libraries with over 50% Black populations in their local market areas were Golden Glades, Model City, Opa-Locka and Little River. The libraries in market areas with over 50% Hispanic populations were Hialeah Gardens, Concord, Fairlawn, Lakes of the Meadow, Shenandoah, Civic Center, Sunset, Doral, West Kendall, Country Walk, Tamiami, Virrick Park, North Shore and Culmer/Overtown. Closing these library branches would thus bring some issues of whether special collections and services that reflect these local communities would now be made available at next-nearest libraries, such as bilingual services and workshops in Spanish, or the museum quality African textiles and sculptures at Model City, or Culmer/Overtown’s special children’s and Black culture collections.

Above all, the public library is the “people’s university” where people can apply themselves to education and learning, with free access to resources they need to ‘pull themselves up by their bootstraps.’ People use the books, journals, databases and computers at the local library to research and work on writing small business plans, search for jobs and write resumes. In their local public libraries, people who don’t have a high school diploma and can’t afford expensive “test prep” classes can still borrow materials for free to study for high school equivalency exams (GEDs), vocational exams and certifications. Communities slated to lose their local libraries which also had the lowest numbers of college-educated populations – 20% or lower were Model City, Civic Center, Opa-Locka, Hialeah Gardens, Golden Glades and Little River. Communities with 29% or more of market area populations having no high school degree were Civic Center, Model City, Opa-Locka, Little River and Culmer-Overtown.

If the 22 Miami Dade libraries are closed, one of the greatest risks would be of those communities becoming isolated from library services and losing habits of regular participation in literacy and reading activities. Maintaining a reading habit is difficult without continuing access to new materials to read. Researchers have found that library use decreases as distance from the library increases (Jue, Koontz et al, 1999) and that ethnic minority groups, low income groups, children, and the elderly often cannot or will not travel far outside of their own neighborhood areas for library use (Hayes & Palmer, 1983; Obokoh & Arokoyu, 1991; Van House, 1983). For low income households, distance is more of a barrier than for wealthy households (Van House, 1983). If the “next nearest” library is too far away, there is the risk that many people in these communities, especially poor people, elderly, children and ethnic minority groups, will simply no longer access libraries.

In a future post, we’ll take a closer look at equity issues in library access, and how closures impact the balance for access among all communities. In the meantime, check out our iMapLibraries site http://imaplibraries.org/ where we have posted our Miami Dade branch level library reports; you can also use our prototype tool to check out library branch level market area data in other local communities nationwide.

– Lorri Mon, Dean Jue and Christie Koontz at Florida State University, for iMapLibraries

References

Jue, D.K., Koontz, C. M., Magpantay, J. A., Lance, K. C., Seidl, A.M. (1999). Using public libraries to provide technology access for individuals in poverty: A nationwide analysis of library market areas using a geographic information system Library & Information Science Research, 21( 3): 299–325.

Hayes, R., & Palmer, E.S. (1983). The effects of distance upon use of libraries: Case studies based on a survey of users of the Los Angeles Public Library Central Library and branches.” Library Research 5: 67 – 100.

Obokoh, N.P. & Arokoyu, S.B. (1991). The influence of geographical location on public library use: A case study from a developing country. SLA Geography and Map Division, 163: 30-42.

Van House, N. A. (1983). Public library user fees: The use and finance of public libraries. Westport, Conn.: Greenwood Press.

Losing Libraries

Miami-Dade Libraries

Miami-Dade Libraries

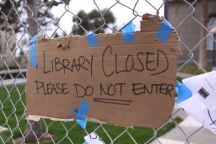
In Miami, Florida, 22 libraries in local neighborhoods will close and 251 more jobs will disappear if a recent decision from the Mayor and Board of Commissioners goes into effect. (See Rebrand Miami’s map showing red pins for the 22 libraries which would close.)

What does it mean in real terms–in the impact on people’s lives–to lose almost half of a major city’s libraries?

Miami Dade County Libraries operates 49 library branch locations and two bookmobiles for a population of 2,496,435 people, making available free public wifi at every location plus 1,735 public computers throughout the library system. Each year, 6,762,294 people visit the libraries, borrowing 6,718,933 items annually, and librarians answer 7,108,830 questions per year.

Let’s get to know a little more about these 22 branch libraries slated for closure:

Some of these libraries have unique histories. Lemon City Branch Library, originally built in 1902, is one of the oldest public libraries in South Florida and was once called the “cradle of civilization for Southeast Florida.” Civic Center Branch Library is the first library worldwide ever to be built on an elevated transit system (it’s also known as the Civic Center Station Porta-Kiosk). West Kendall Regional Library has faced its doom once before, when it was destroyed by Hurricane Andrew in 1992. Two thousand people attended its reopening ceremony in 1994.

Some of these libraries offer unique physical spaces and special resources. Virrick Park Branch Library is known for its beautiful stained glass decor and is situated near a park. Culmer/Overtown Branch Library has an in-depth Black culture collection including many out-of-print special items. Doral Branch Library has a “Big Cozy Books” room. West Kendall Regional Library provides a large auditorium for programs and special events. Model City Branch Library has an art display of museum quality African textiles and African sculpture, and special collections for adults and children on African-American history, culture and literature.

Many of these libraries serve diverse communities. North Shore Branch Library, situated two blocks from the Miami Beach seashore, serves a multicultural community which includes seasonal tourists from France, Canada and Germany. Fairlawn Branch Library serves Hispanic immigrants as well as seniors from West Miami, Fairlawn and Flagami. Model City Branch Library in Liberty City serves African-American, Haitian and Hispanic populations. Lemon City Branch Library is located in “Little Haiti” and Little River Branch Library is located in the heart of the Haitian community. Hialeah Gardens Branch Library serves a largely Hispanic community. Many libraries offer special programs tailored to their communities such as Spanish language computer classes at Hialeah Gardens Branch Library, Concord Branch Library, and Palm Springs North Branch Library. Little River Branch Library offers computer literacy classes for seniors.

The libraries offer places for kids to study, learn, and play. Culmer/Overtown Branch Library was Miami-Dade’s first child-focused branch, with 60% of the collection devoted to items for kids. Shenandoah Branch Library offers a Reading Ready Early Literacy center with interactive play-to-learn resources. Many of the libraries also provide special programs for kids and teens, such as Summer Reading programs and other special events. Little River Branch Library offers storytelling, crafts, book discussion, and homework help for kids. Concord Branch Library provides arts & crafts, puppet shows, and classes such as scrapbooking. Lakes of the Meadows Branch Library is the public library serving school children from G. Holmes Braddock Senior High School and Jane S. Roberts Elementary School, and recently offered a Book Discussion Group and a Teen Game Day. A Live Teen Rock Performance event as well as storytimes in English and Spanish, and summer reading programs are offered at West Kendall Regional Library. Shenandoah Branch Library has programs for children and teens in areas such as art, literacy, crafts, games, anime and manga, and at Country Walk Branch Library, special programs focus on babies, toddlers, and reading-ready early literacy toddler storytimes, and there are computers with software for early literacy skill development such as matching, color identification, word recognition and preschool games.

These 22 libraries also offer a local “safety net” of free access to computers, wifi and Internet for local communities. For example, 8 computer terminals and 6 laptops are available at Sunset Branch Library; 21 computers at Fairlawn Branch Library; more than 25 computers at South Shore Branch Library; 16 computers and 20 laptops at Shenandoah Branch Library; and 54 computers at West Kendall Regional Library. Model City Branch Library includes two literacy computers to enhance reading and writing comprehension, and two multimedia computers with word-processing capabilities. California Club Mall Branch Library has 20 computers and 6 laptops. These libraries also offer workshops to help with resume writing and job search, as for example at Little River Branch Library, North Shore Branch Library, South Shore Branch Library, Lakes of the Meadows Branch Library and Tamiami Branch Library in West Dade.

In Miami-Dade, and elsewhere around the country, it’s time to start telling the story of our individual library branches in local communities. Let’s collect and share the data that tells the story of the impact ALL our local libraries are making on people’s lives.

– Lorri Mon, Associate Professor at Florida State University, for iMapLibraries

Public Libraries & Special Spaces: Building Community

Girl using a computerLibraries play a unique role in community building – not only through sharing books and information, but also by offering special spaces where people in the community can meet in small groups, classes, workshops, or in large audiences — such as auditoriums and lecture halls. For example, Teton County Library has auditoriums and half-auditoriums available with audio-visual and projection screens, as well as meeting rooms. Providence Public Library hosts a Music Film & Concert Series and Houston Public Library has both poetry events and open-mike poetry nights, while Ann Arbor District Library hosts gaming tournaments.

Libraries provide showcases for local artists, with exhibit and gallery spaces such as at Olean Public Library and Charleston County Library. Libraries also offer spaces for building and creating. such as Chicago Public Library’s digital media youth learning spaces, and Cleveland Public Library’s TechCentral which includes 3-D printing. Some libraries even offer outdoor learning spaces, such as the low-water-use demonstration Botanical Garden at Glendale Public Library and the Children’s Living Library Garden at Huntsville Madison County Public Library.

Libraries provide special Centers for helping with important community needs – Santa Cruz Public Library reserves Homework Center computers for kids’ schoolwork during special hours, with the first 10 pages of homework printed for free. Springfield Free Public Library’s Read/Write/Now Adult Learning Center teaches reading for adults at the Pine Point branch. Nashville Public Library and Seattle Public Library are two among many offering Job Search and Job Resource Centers. Many other libraries offer special research centers such as the A.C. Bilbrew Library’s Black Resource Center, Arlington Public Library’s Center for Local History, Belmont Library’s Enrico Fermi Cultural Center for Italian American resources, and the Folklife Center at Crandall Public Library.

Some libraries extend special spaces out into the community – for example, Schaumburg Township District Library has ten “deposit sites” in the local community at places such as senior centers, providing collections that rotate every six months. Many libraries operate mobile special spaces via vans, buses, and even bikes – such as Seattle Public Library’s Books on Bikes. Missoula Public Library’s mobile computer lab also offers passport and notary services.

Does your library offer special spaces to the community? Check out our iMapLibraries’ Special Spaces map.

You can also add your library’s information to the map!

To find out more about iMapLibraries, visit us at : http://imaplibraries.org/

– Lorri Mon, Associate Professor at Florida State University, for iMapLibraries

Placing Public Libraries at the Common Core

trucereading

Everyone is buzzing about the Common Core, but are public libraries joining the Common Core conversation?  Reading is at the center of this discussion – creating a powerful opportunity for libraries to demonstrate their valuable role and contributions. 

How does the Common Core work for reading?  In brief, the Common Core assigns Lexile ranges as targeted reading levels for students at each grade level.  For students graduating high school to be “college and career ready,” the target is to be reading books at the 1450 Lexile score level.  For younger students, here are K-12 Common Core grade levels and Lexile reading level target ranges.  You can look up Lexile scores of specific books online using a “Quick Book Search,” or search by Lexile score to find recommended books in a variety of subject categories.

This brings up the question – are we tracking the data that would show funders and government officials how our public libraries are supporting the Common Core?  For example – does your library track data showing Lexile ranges of books checked out from the juvenile collection during a summer reading program, or other data that shows how the library supports public schools teaching the Common Core?  Is there other data we should be tracking to help better make our case about how libraries support teachers, schools, students, and Common Core reading goals?  Would love to hear your thoughts and ideas about this! 

– Lorri Mon, Associate Professor at Florida State University, for iMapLibraries

(For more about the Common Core, see Paige Jaeger’s blog post on Lexiles & Readability; you can also download Common Core language arts and math quick reference apps for Android and iPhone/iPad)

The Impact of the Library on Lives

We all collect data in our work on libraries, but is it the right data to be able to tell the story of our library’s impact on people’s lives?

When a member of Congress asks – “how has the library helped my constituents?” are we able to answer?

We can talk about total books circulated, but not about how many people sought jobs or retrained for careers at the library. girl reading a book
We can show total reference questions answered, but not how the library has improved the reading ability of schoolchildren.

This is a problem, because our data should be showing the fundamental role the library plays toward solving society’s critical issues – helping people to educate themselves and raise themselves out of poverty, improve their health and nutrition, increase their reading ability, find and apply for jobs, and learn to use technologies.

What are the new metrics for demonstrating the library’s impact on people’s lives? In iMapLibraries, we’re exploring new metrics for “putting libraries on the map” for special programs and services offered in libraries such as:

classes and workshops (computers, ESL, workforce readiness, health, e-government assistance and more)
senior services (such as homebound delivery programs)
Spanish services (such as reference services in Spanish, workshops in Spanish)
Special spaces available (such as fab labs/Makerspaces, homework centers, meeting rooms etc.)

But libraries do more to help people in our community, and here are some metrics that could help to show that:

How has the library helped people retrain and improve their employability? [Circulation of — test-taking prep books and software for GED and other exams, use of test prep digital resources in the library; counts of reference questions answered on exam prep]
How has the library helped people seeking jobs? [Counts for – use of job seeking books and digital resources, attendance at workshops on resume writing and job seeking skills; counts of reference questions answered on job seeking and resume writing]
How has the library helped people start small businesses? [Circulation of – books on starting a small business and writing a small business plan, attendance at workshops on small business; counts of reference questions answered on starting a small business and writing small business plans]

How could we track these new metrics of the library’s impact on lives? Some possibilities:

in-house usage reshelving counts of “how to” books left out each day on technology, exam prep, job seeking and small business startup;
circulation statistics for exam prep, job seeking and small business startup items checked out with a library card; and,
attendance statistics for workshops from signup sheets, library card checkins, head counts, or filled/empty seat counts during the session

Does your library have a way of tracking and counting data that helps you to show an impact on people’s lives? Please share your ideas in the comments or email me at imaplibraries@gmail.com – I’d love to hear about it!
— Lorri Mon, Associate Professor at Florida State University, for iMapLibraries